
Orchestrated Analysis
When the Tool Orchestration Service is enabled, the Orchestrated Analyses page can be used to view the portion of an analysis that's orchestrated on your Kubernetes cluster. Keep in mind that a Software Risk Manager analysis may include bundled tools for which Kubernetes support is unavailable—the Orchestrated Analysis page will not include information about those tools.
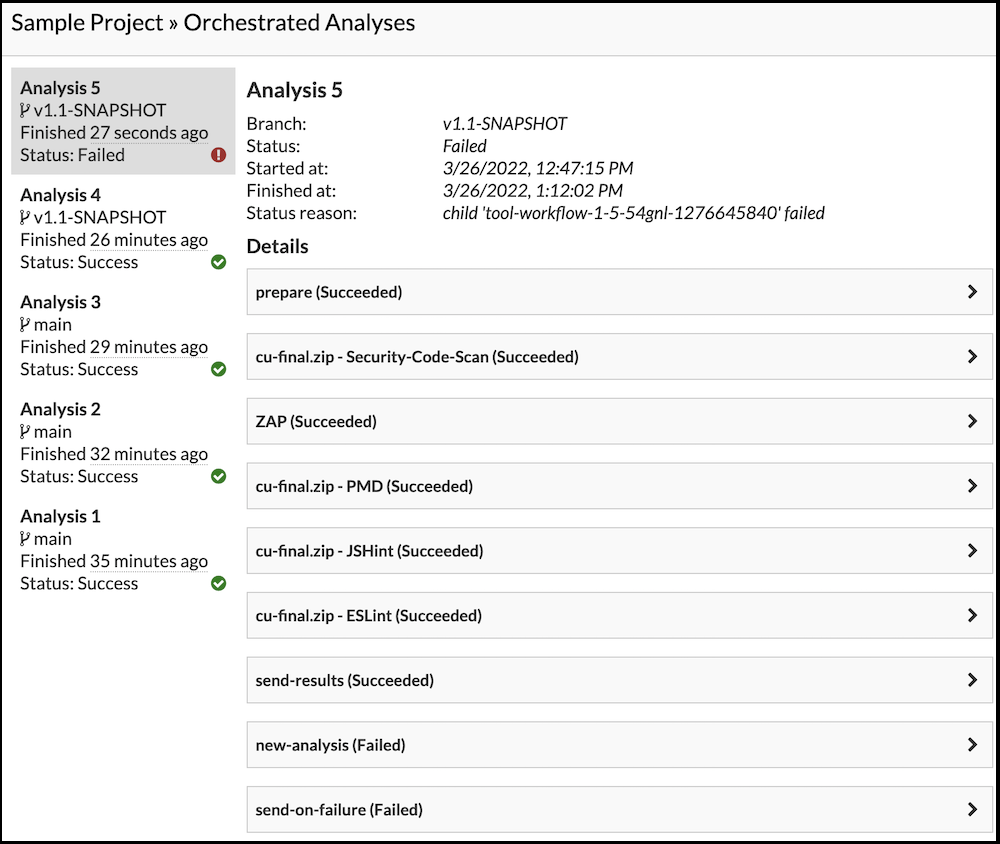
Every orchestrated analysis for a project will appear in a list on the left.
Software Risk Manager will automatically select the most recent analysis when you visit the page. Selecting an analysis lets you see summary information to include analysis status and start time. An orchestrated analysis has a unique, numerical identifier and executes as a multi-step workflow running on Kubernetes. Under the status information, you will find collapsed sections that represent each workflow step. Steps labeled with an ID and tool name represent tools running on your cluster. They differ from system steps, like prepare, which support the overall workflow.
An orchestrated analysis that completes successfully will show a Success status, also represented with a green checkmark icon in the analysis list. Failed analyses will show a Failed status and a red exclamation icon. The summary information for failed analyses will include a Status reason field that may provide further information. Failed steps may also include a Message field describing why a step failed to complete successfully.
Orchestrated analyses abandoned by previous Software Risk Manager instances continue to run to completion. Software Risk Manager will display a message when there's an orchestrated analysis whose results will be entered into Software Risk Manager as a brand new analysis.
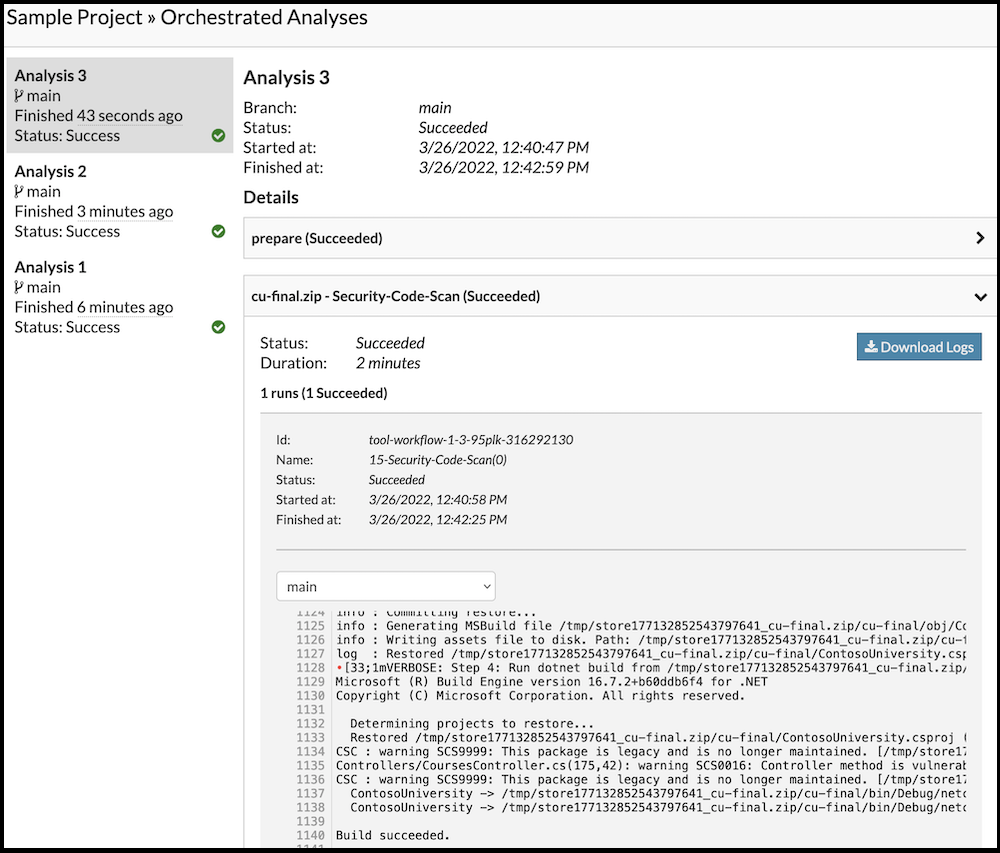
Viewing Logs
Every workflow step includes one or more logs. You can expand a step section to reveal a log viewer with support for live updates showing log data available from the Kubernetes API. Software Risk Manager shows you the *main* log by default, but you can view log data from other available sources using the dropdown shown below.
For tool completed steps, you can click Download Logs to fetch every tool log referenced by the tool's registration data. The Download Logs option will be unavailable when a tool run is in progress. Keep in mind that add-in tool authors may write log data that's unavailable via the Kubernetes API, so downloaded logs may include data that's not included in what's shown with live updates on the Orchestrated Analysis page.
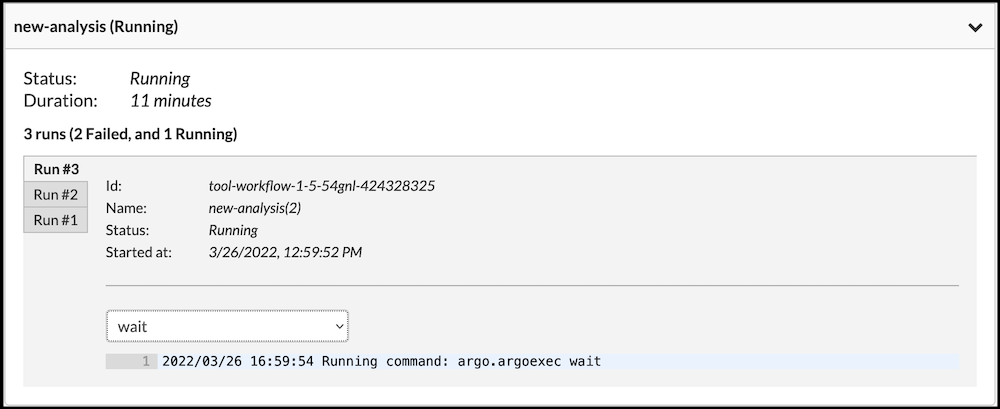
Some steps of an orchestrated analyses may repeat in an attempt to recover from unexpected failures. How often they repeat and with what delay in between is step dependent. When log data is available for multiple tries, a "tabbed" log viewer will be displaed. Each tab will show you the log details for a specific attempt.
Termination
Software Risk Manager lets you stop orchestrated analyses from running to completion. Click Terminate to submit a request to cancel an analysis.
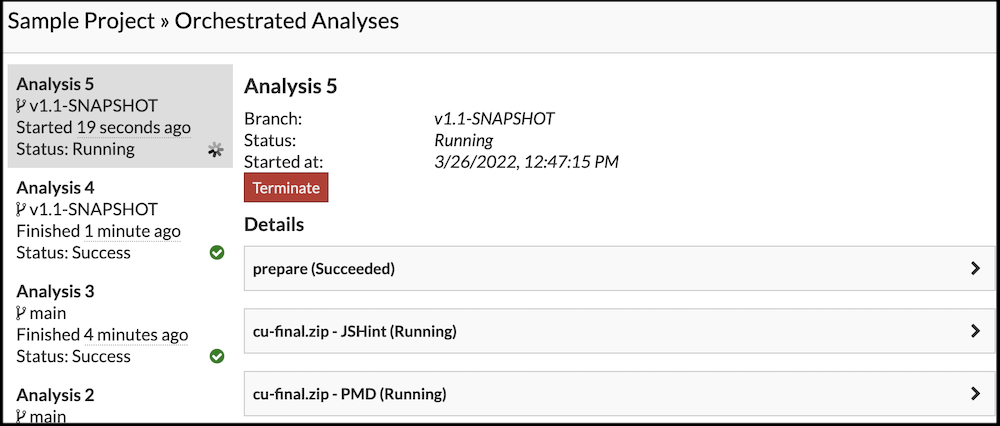
It may take a few moments before an analysis displays a terminated status, but you will see immediate feedback indicating that your termination request has been submitted, and you will not be able to submit additional termination requests.