Project Dashboard
The Project Dashboard provides a comprehensive overview of a project, displaying a set of analytic and trend data which are automatically updated as you use Software Risk Manager.
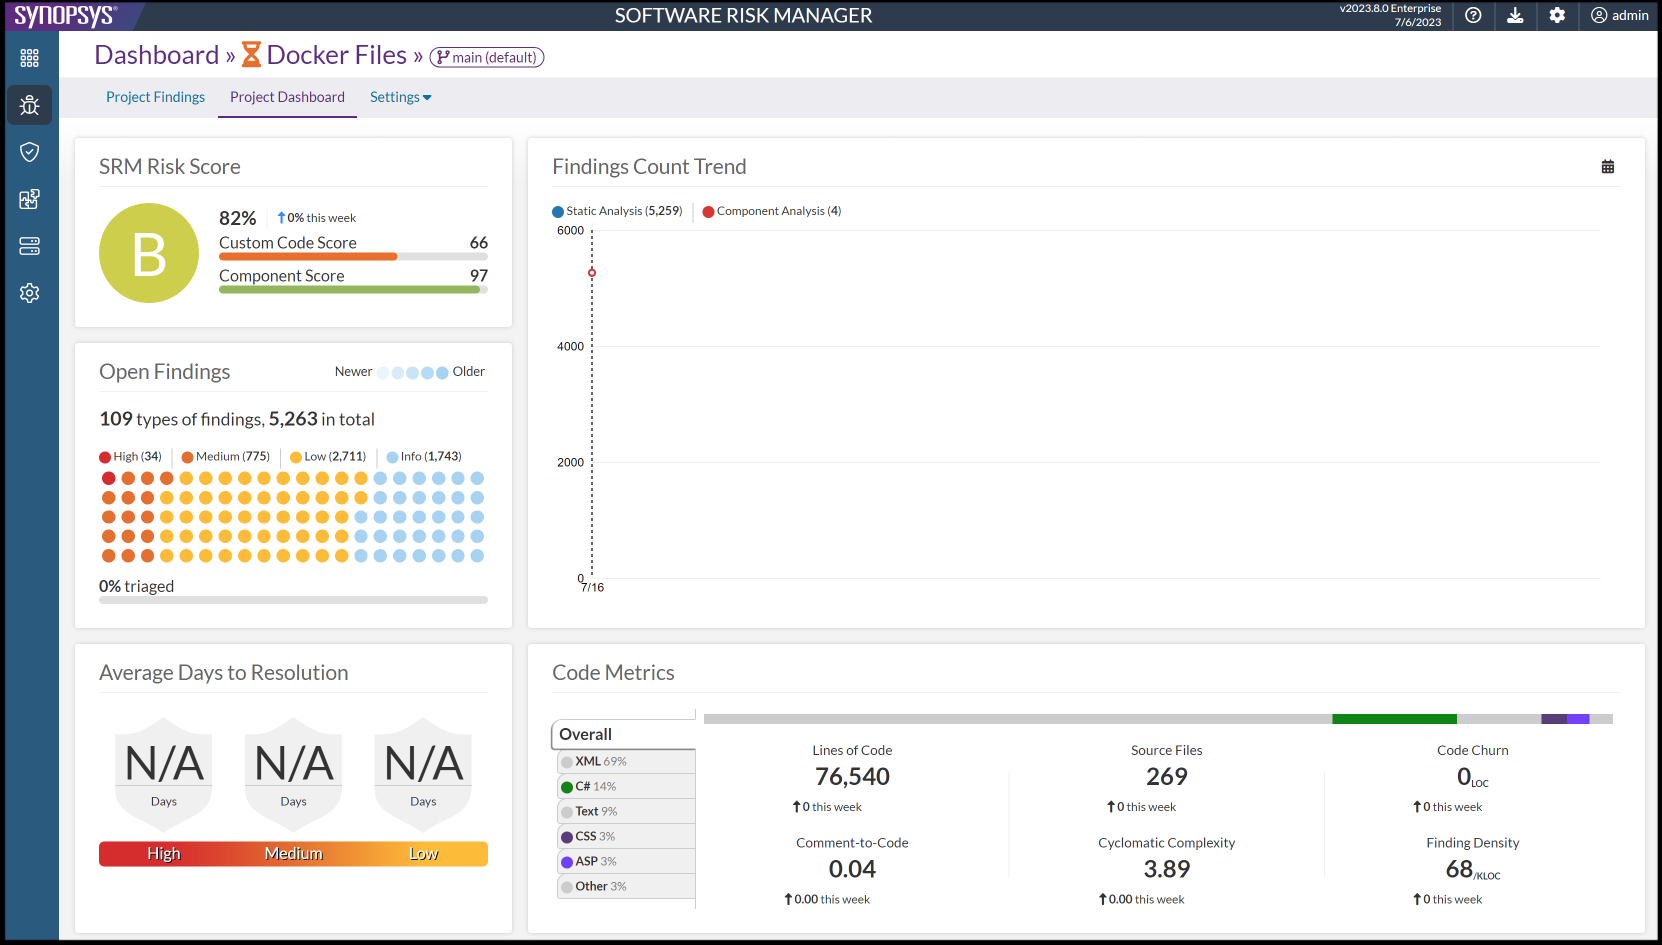
- From the findings page, click the Project Dashboard tab at the top of the page.
- From the project list page, open the task dropdown list and select "Dashboard."
When viewing the Project Dashboard for the parent of grouped projects, you will have the option to include data from the child projects by using the roll-up feature. To do this, enable the Include child projects switch on the top right corner of the Project Dashboard page.
You can also access the Project Dashboard for "all projects" by clicking the "Dashboard" tab while on the aggregate "All Projects" Findings page.
While on the Project Dashboard page for a project with multiple branches, you can switch the view to a different branch by clicking the branch selector dropdown in the page header.
Dashboard Data
- Risk Score. Provides a "letter grade" to indicate the overall quality of the project.
- Open Findings. Displays the total number of findings, along with a breakdown of the number of findings in each category and the percentage of findings that have been triaged.
- Findings Count Trend. Shows the number of findings over time, broken out by detection method.
- Average Days to Resolution. Shows the average number of days it took to resolve an issue, broken out by severity.
- Code Metrics. Displays various metrics for the project's codebase, such as the number of lines of code, number of source files, etc., broken down by language.
- Analysis Frequency. Provides detailed information about when the analysis was run, how long it took, tools used, etc.
- Activity Monitor. Displays a "calendar heatmap," representing the analysis activity on the project over the past year.
- Created vs. Resolved. Provides a visual representation of the dueling trend of new findings that are added to the project and findings that are resolved by the team, along the difference between the two.
- Top Finding Types. Shows the top 10 types of findings in the project, by number of open findings.
Risk Score
The Software Risk Manager Risk Score section of the Project Dashboard provides a letter grade to indicate the overall "quality" of the project.
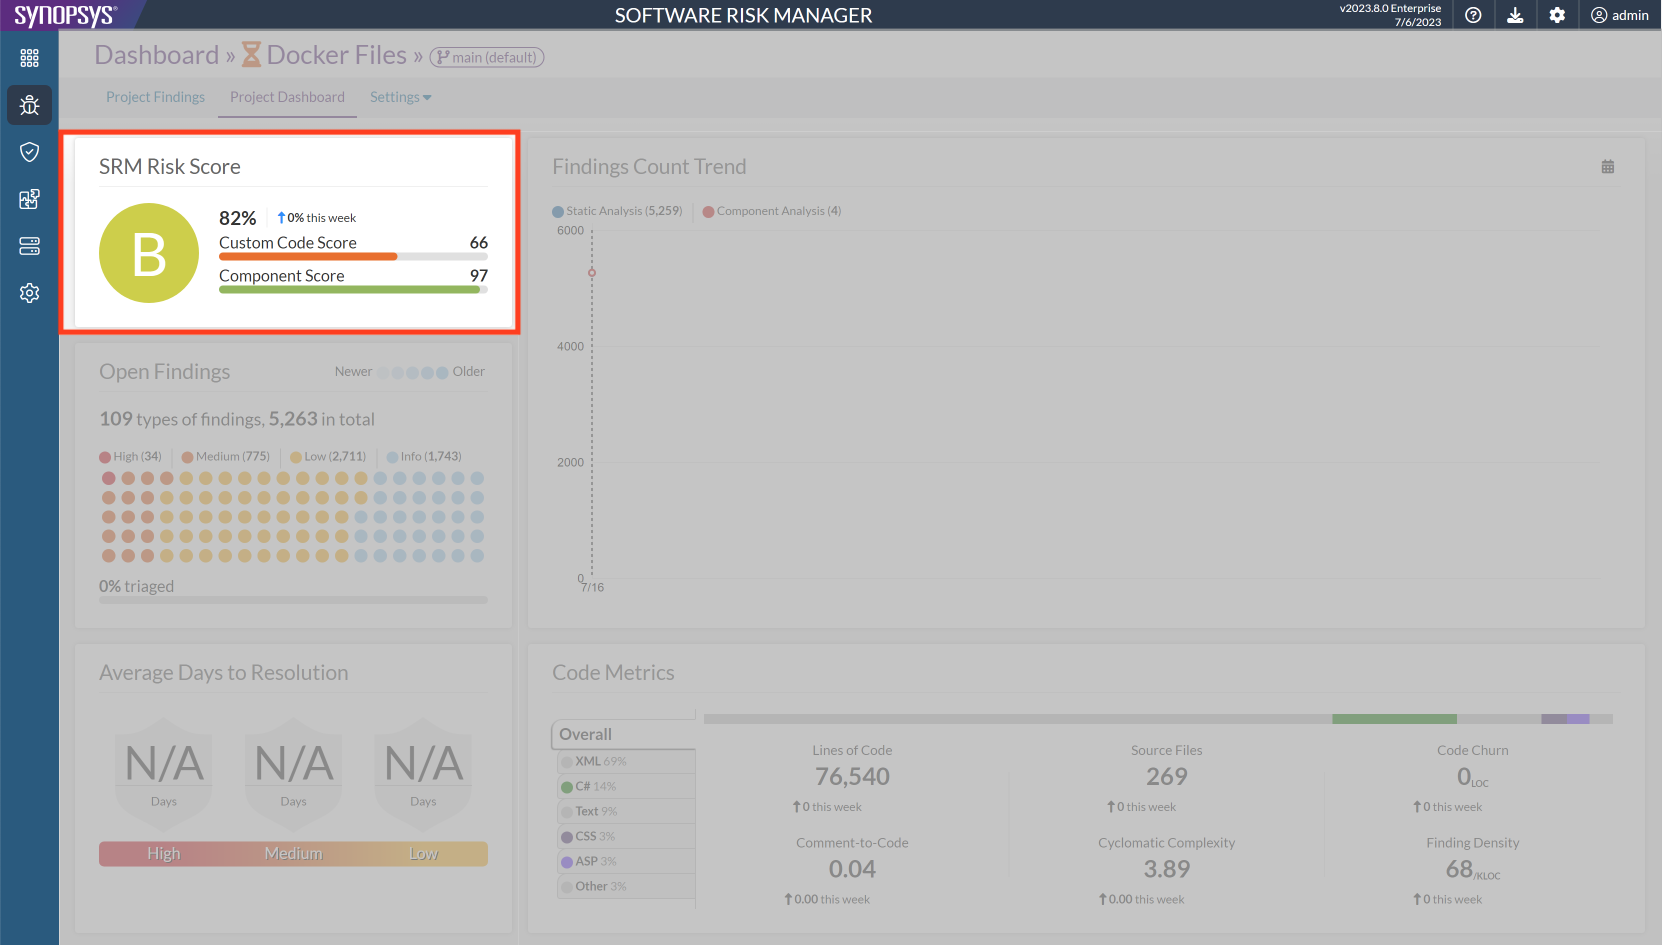
The letter grade is based on a percentage score, which is the average of the Custom Code Score, Component Score, and Infrastructure Score. Each score is weighted evenly, but note that an Infrastructure Score is not available for all projects. The score letter grades are = A, [80, 90) = B, [70, 80) = C, [60, 70) = D, [0, 60) = F.
- Custom Code Score starts at 100% and is reduced based on the "volume" and
"variety" of non-"Component" and non-"Infrastructure" findings.
- volume penalty =(3.0% × log2(num_critical_findings + 1)) +(1.5% × log2(num_high_severity_findings + 1)) +(0.75% × log2(num_medium_severity_findings + 1)).
- variety penalty =(3.0% × num_critical_finding_types) +(1.5% × num_high_severity_finding_types) +(0.75% × num_medium_severity_finding_types).
- Component Score starts at 100% and is reduced based on the "volume" of
"Component" findings. "Component" findings are any findings found when running
Component tools.
- volume penalty =(3.0% × num_critical_component_findings) +(1.5% × num_high_severity_component_findings) +(0.75% × num_medium_severity_component_findings).
- Infrastructure Score (only reported for projects that have findings from
infrastructure analysis) starts at 100% and is reduced based on the "volume" of
infrastructure findings. Infrastructure findings are any findings found when
running Infrastructure or Cloud
Infrastructure Tools.
- volume penalty =(3.0% × num_critical_infrastructure_findings) +(1.5% × num_high_severity_infrastructure_findings) +(0.75% × num_medium_severity_infrastructure_findings).
Each of the "num_" values mentioned above refer to findings in the project which haven't been triaged (i.e., findings whose triage statuses haven't been marked as one of the "resolved" statuses like "Fixed" or "False Positive"). In the case of "volume," they refer to the number of findings. In the case of "variety," they refer to the number of distinct types of findings. Only critical, high, and medium severity findings are counted against the Software Risk Manager Risk Score.
Next to the letter grade, the specific percentage score is displayed alongside a spark-line that shows the general trend of the project's Software Risk Manager Risk Score over the past week.
The individual scores for the Custom Code Score and Component Score are shown by a pair of "fill bars" next to the letter grade, below the overall score percentage.
For more information on how these scores are calculated and how to customize the formula, see the Software Risk Manager Scoring Calculations section in the Software Risk Manager Install Guide.
Open Findings
The Open Findings section shows the overall "triage status" of the project.
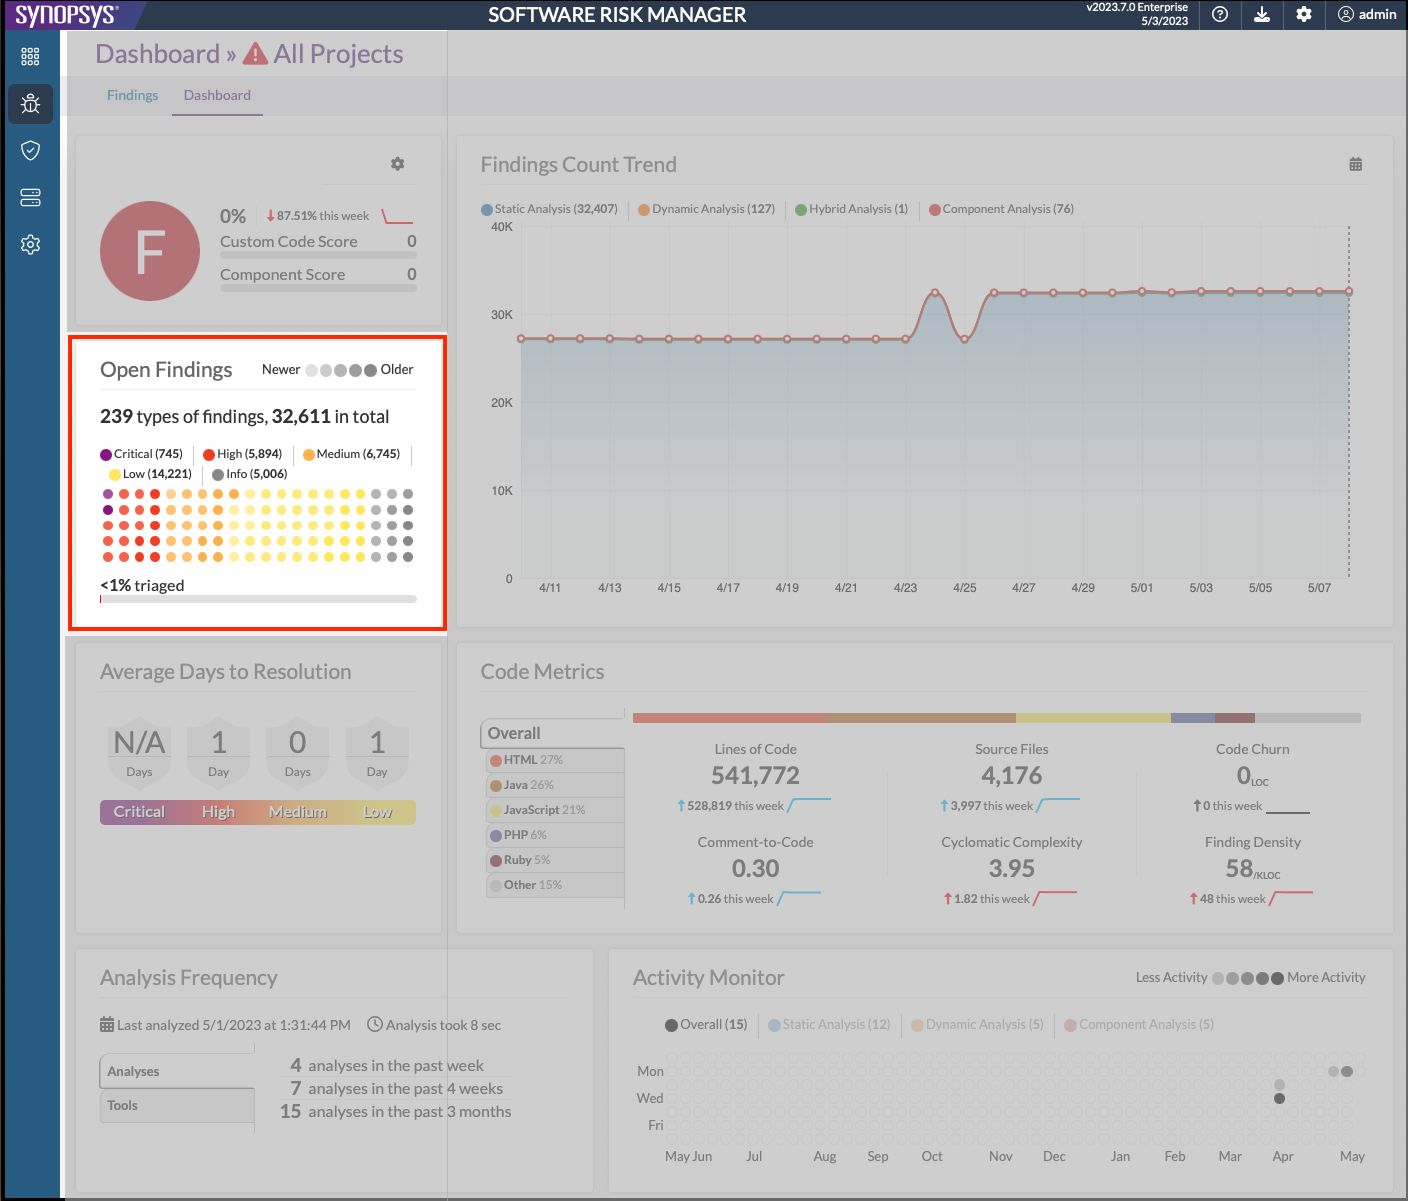
A waffle chart is used as a severity-age breakdown of the untriaged findings in the project. Different colors indicate different severities, as indicated by the legend. The number of dots of each color indicate the percentage (rounded) of findings in the project which have that specific severity. I.e. if there are 19 purple dots, it means 19% of the untriaged findings have "critical" severity. Transparency is used to indicate the relative age of the findings, as indicated by the legend. A lighter (more transparent) version of the severity color indicates findings of that severity which are relatively new. A darker (more opaque) version of the severity color indicates findings of that severity which are relatively old.
Clicking on the severity labels in the waffle chart's legend will cause the chart to focus on that severity, fading the other severities from view. Clicking again on the same label will reset that focus, returning the visualization to its normal state.
Hovering the mouse cursor over the severity labels in the waffle chart's legend, or over the colored dots in the waffle chart itself will cause the chart to temporarily focus on that severity. This effect is similar to the click effect described in the previous paragraph, but the effect does not persist if the mouse leaves the area that caused the focus. Hovering the mouse over the chart will also show a tooltip containing a summary of the respective hovered severity.
Below the waffle chart is a fill-bar indicating the percentage of findings which have been triaged (i.e. set to Fixed, Mitigated, False Positive), out of the total number of findings in the project, excluding findings that are marked "Gone".
Findings Count Trend
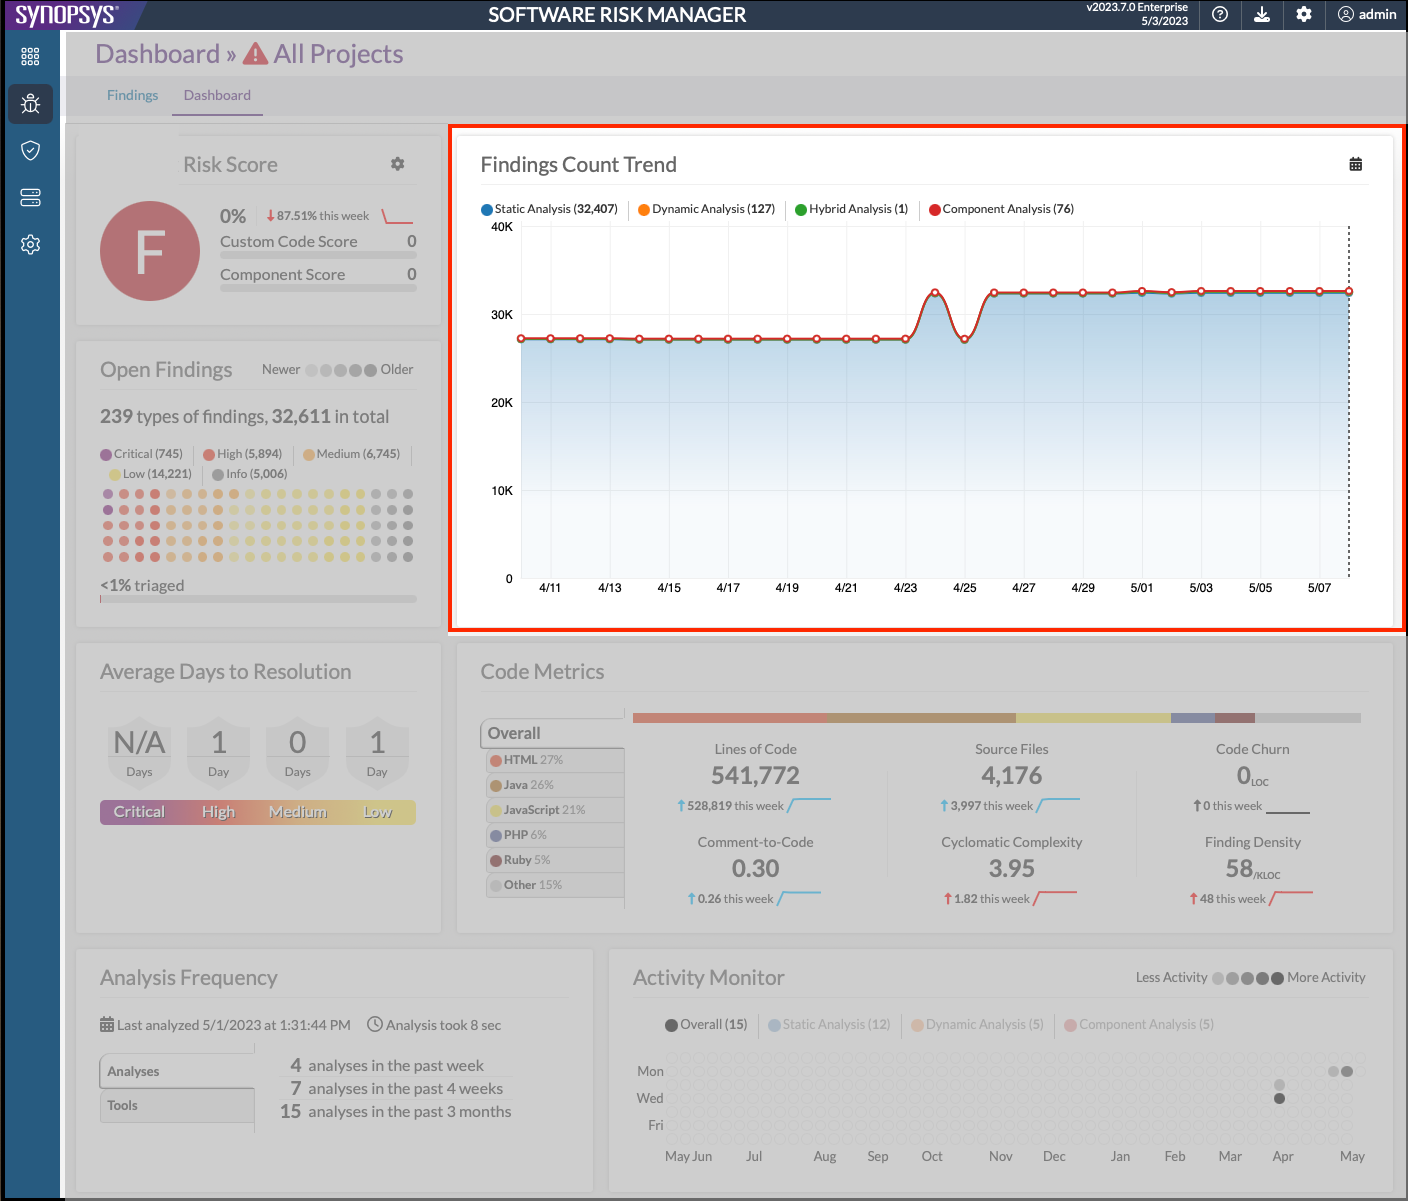
The Findings Count Trend section of the Project Dashboard shows a breakdown of findings by "detection method" over time.
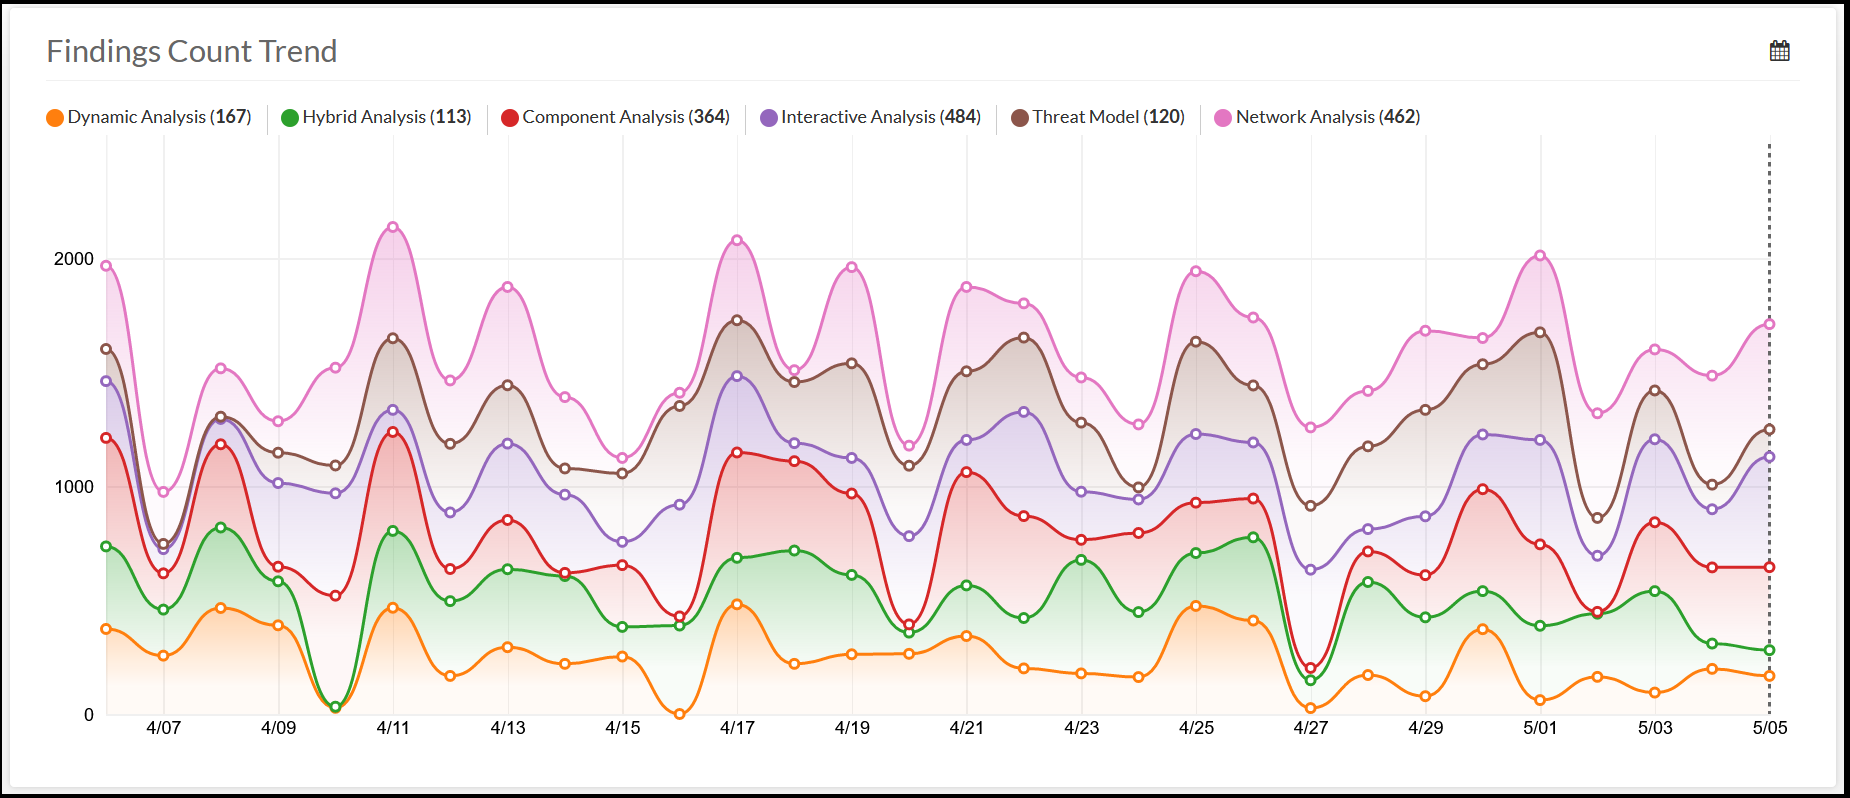
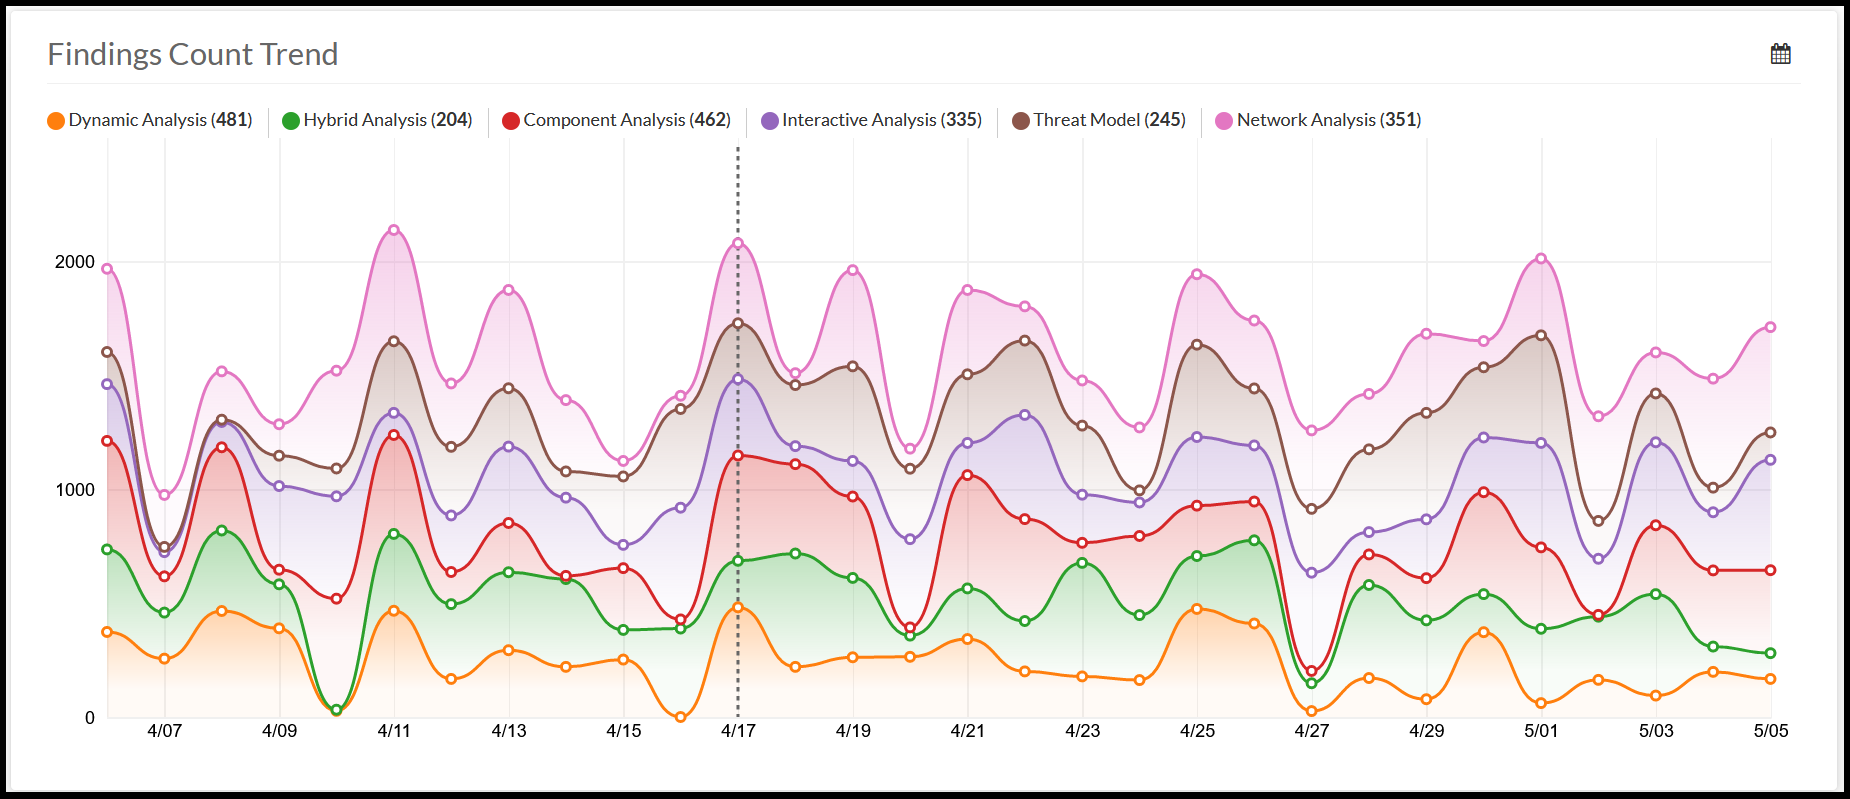
The Findings Count Trend visualization uses a stacked area chart, with "date" as the X axis, and total finding count as the Y axis. By default, an area for each detection method is shown, so that the stacked areas' total height indicates the total number of findings at a given date. Clicking one of the detection method labels in the legend will cause the visualization to focus on the respective detection method, hiding the other areas and moving the focused area to the bottom of the visualization. Clicking again on the same detection method label in the legend will remove the focus effect, returning the visualization back to its default state.
Hovering the mouse cursor over the visualization will cause a vertical line to snap to the nearest date, updating the legend to reflect the finding counts at that date. While the mouse cursor is not over the visualization, the vertical line will snap to the latest date, causing the legend to reflect the most recent finding counts
On the top-right of the trend graph is a calendar icon, which can be clicked to bring up a menu for selecting a date range.
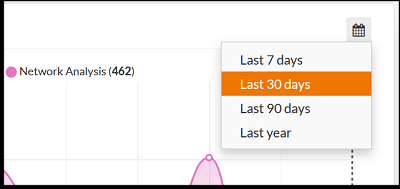
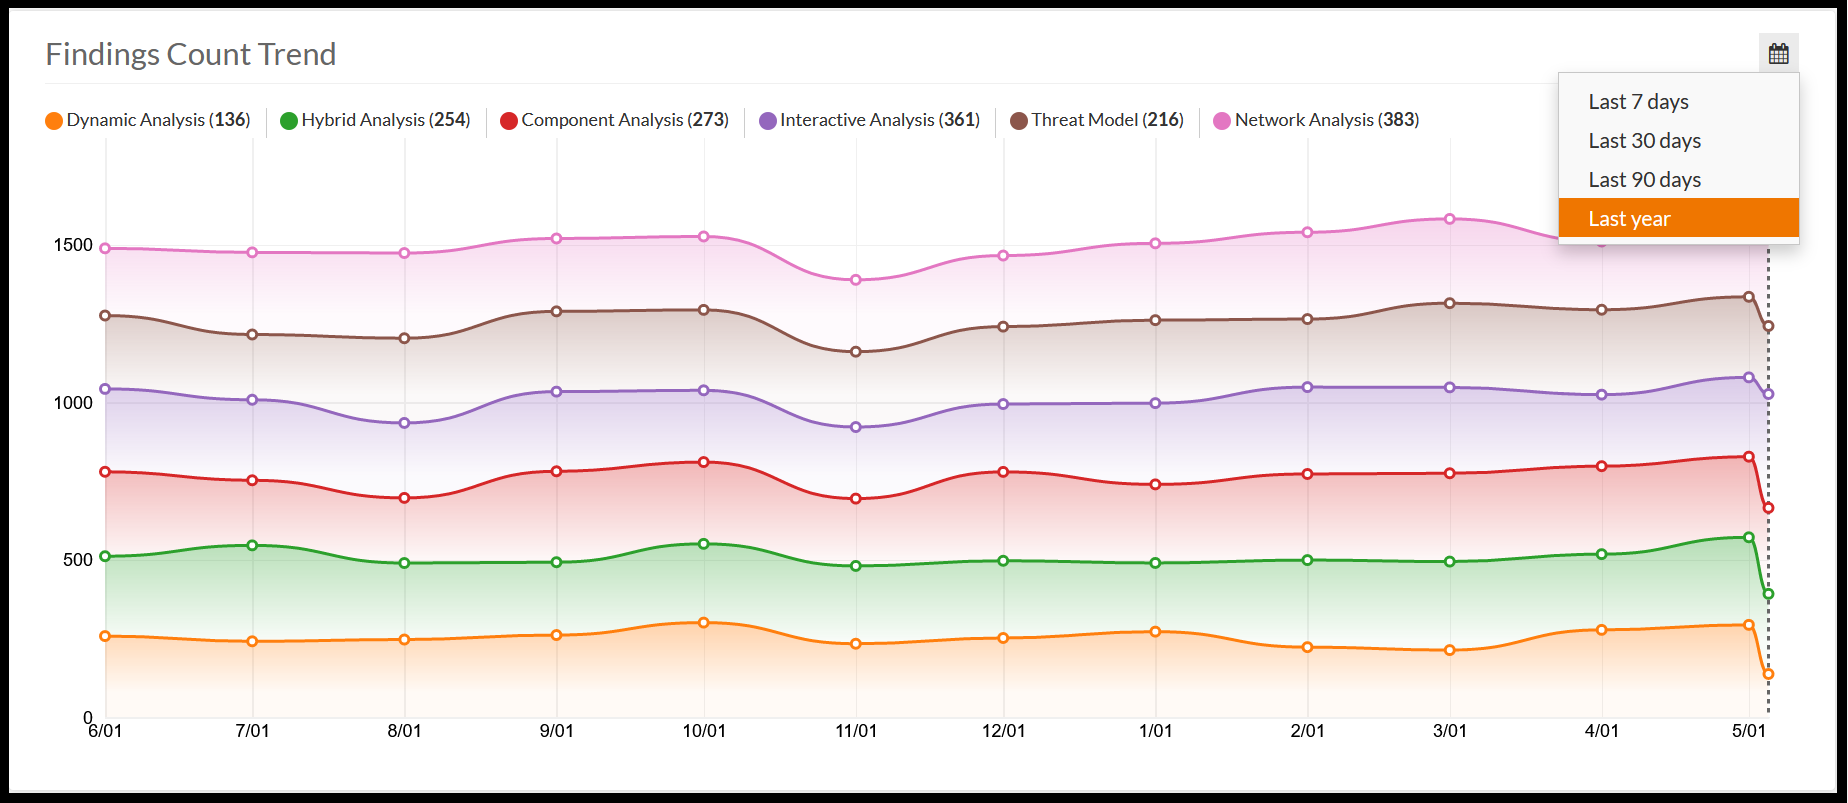
Selecting one of these range values will automatically refresh the graph to the selected range. For larger date ranges, each point in the graph can represent multiple dates by taking the average of data samples involved.
Average Days to Resolution
The Average Days to Resolution section of the Project Dashboard shows the average number of days it takes for a new finding in the project to be resolved.
In this context, resolution means the finding either becomes "Gone" (because developers fixed the issue, and a new analysis did not encounter the same finding), or its triage status was set to one of the "resolved" statuses: False Positive, Fixed, Ignored, or Mitigated.
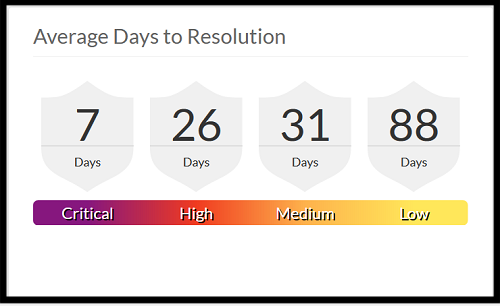
For each severity, the average number of days it takes to resolve a finding of that severity is displayed in a badge. Initially, each badge will display "N/A"; since no findings have been resolved, there is no "average" time. A colored bar below the badges acts as a legend, and hovering the mouse cursor over a badge causes it to become highlighted with that severity's respective color.
As a rule of thumb, teams may wish to prioritize addressing higher-severity findings, so team leads will want to see a lower number of days-to-resolution for higher-severity findings.
Code Metrics
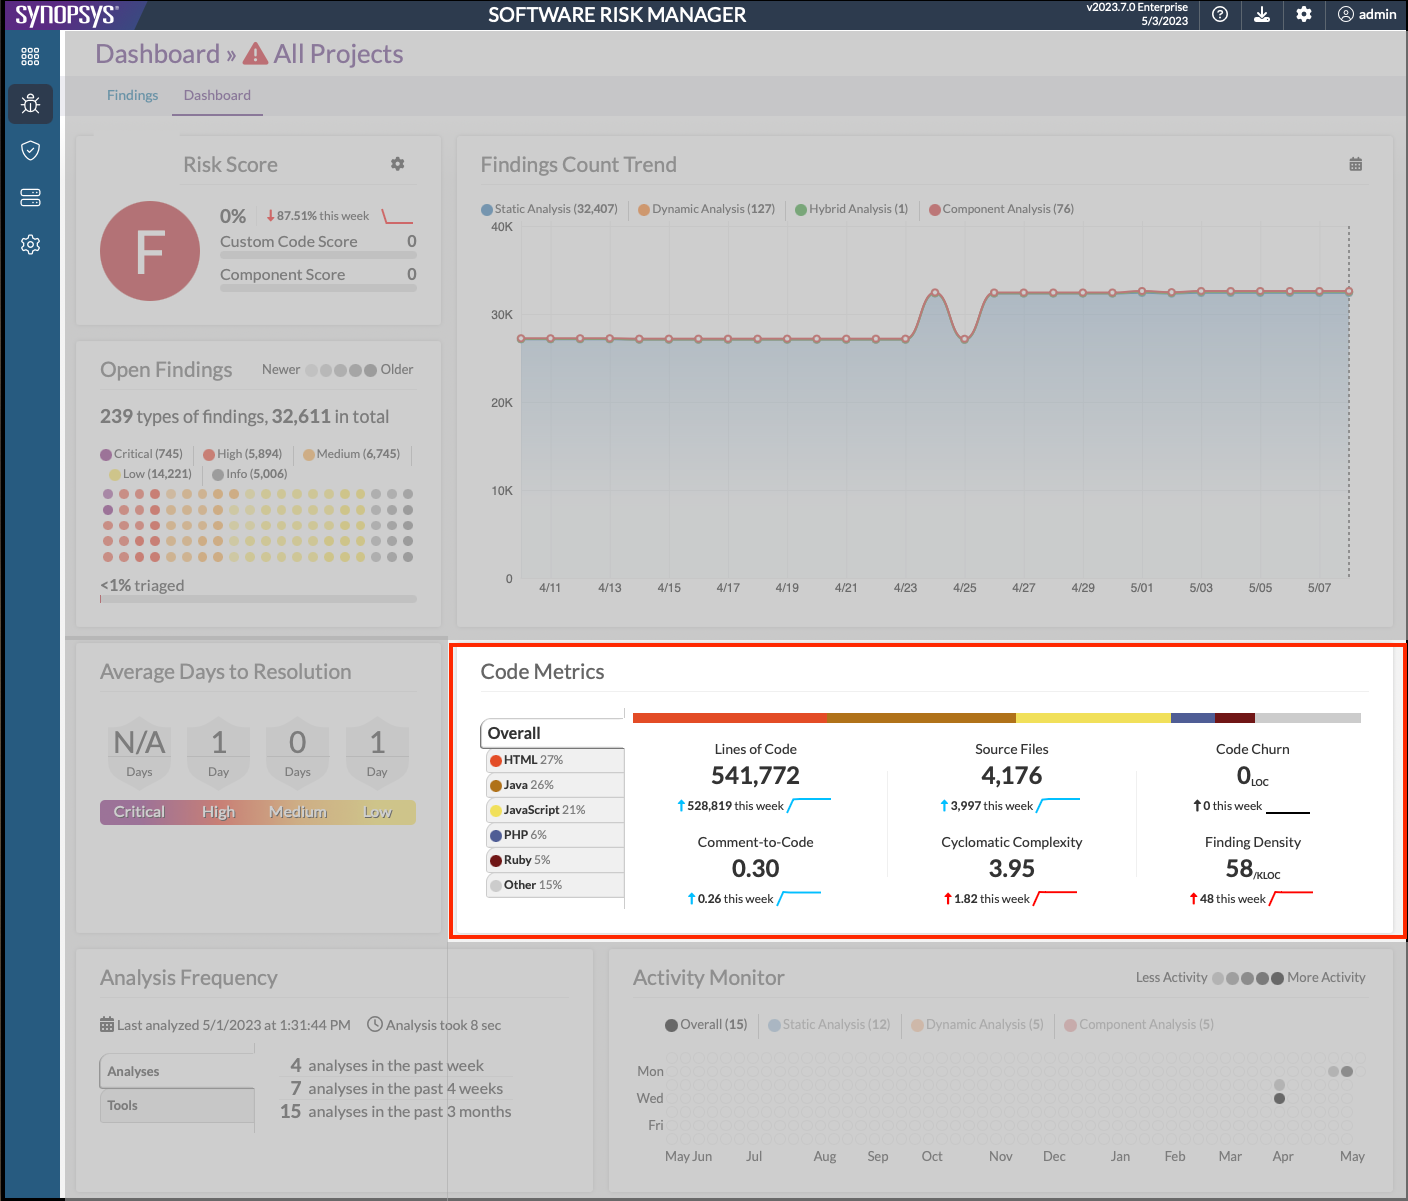
The Code Metrics section of the Project Dashboard displays a set of metrics for the project's codebase, broken down by language.

On the left of the section, a legend shows:
-
An "Overall" group which represents the entire codebase; the sum of the metrics for each language.
-
The top 5 languages (by percentage of lines of code in the respective language compared to the total number of lines of code).
-
An "Other" group which contains the summation of any other languages after the top 5.
The colors assigned to each language are purely aesthetic, and are chosen using the same color scheme that Github uses.
By default, the "Overall" group is selected, so the metric areas to the right will show stats for the whole codebase. Clicking one of the languages, or the "Other" group in the legend will cause the metric areas to display language-specific stats. Clicking on the "Overall" group will return the display to its default state.

When focused on a particular language, each metric will show an "X / Y" value instead of the usual "Y". The "Y" indicates the metric's value for the entire codebase, and the "X" indicates the metric's value for the subset of the codebase which is written in the focused language.
Each metric area will also show a sparkline indicating that metric's trend over the past week. The sparklines will be colored blue for "good" changes, and red for "bad" changes.
List of Code Metrics
-
Lines of Code shows the number of lines of code (including blanks and comments) in the project's codebase. A rising number of lines of code is considered "good", as it implies the project is growing.
-
Comment-to-Code shows the ratio of the number of comment lines to the number of total lines of code in the project's codebase. A rising comment-to-code ratio is considered "good", as writing comments is good development practice.
-
Source Files shows the number of source files in the project's codebase. A rising number of source files is considered "good", as it implies the project is growing.
-
Cyclomatic Complexity shows the average cyclomatic complexity number (CCN) of the project's codebase. A falling CCN is considered good, as less-complex code is easier to maintain.
-
Code Churn shows the number of changed lines of code. Since all dashboard data is collected nightly, the value displayed today indicates the amount of code churn that occurred yesterday. A rising code churn is considered "bad", as high churn tends to increase the chance of introducing new vulnerabilities.
-
Finding Density shows the number of findings per thousand lines of code in the project's codebase. A falling finding density is considered "good" since it means the defective percentage of the codebase is shrinking.
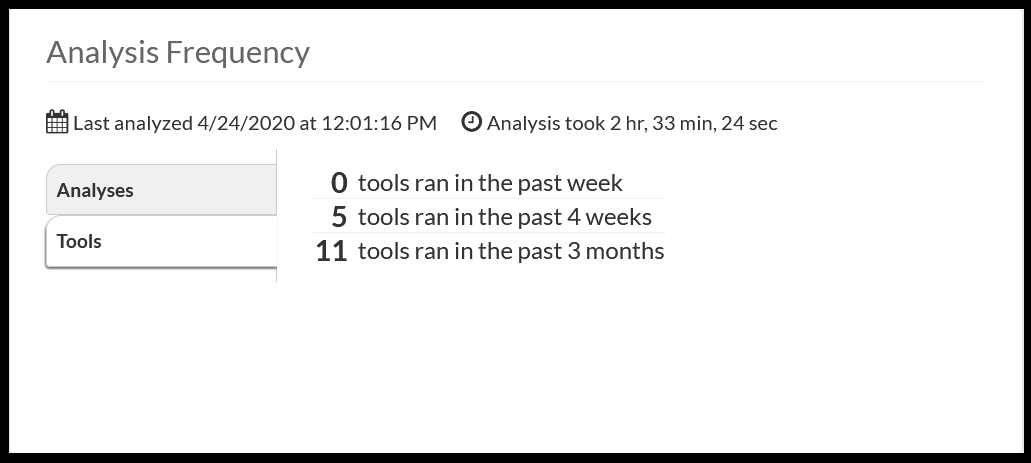
Analysis Frequency
The Analysis Frequency section of the Project Dashboard offers a summary of the project's most recent analyses.
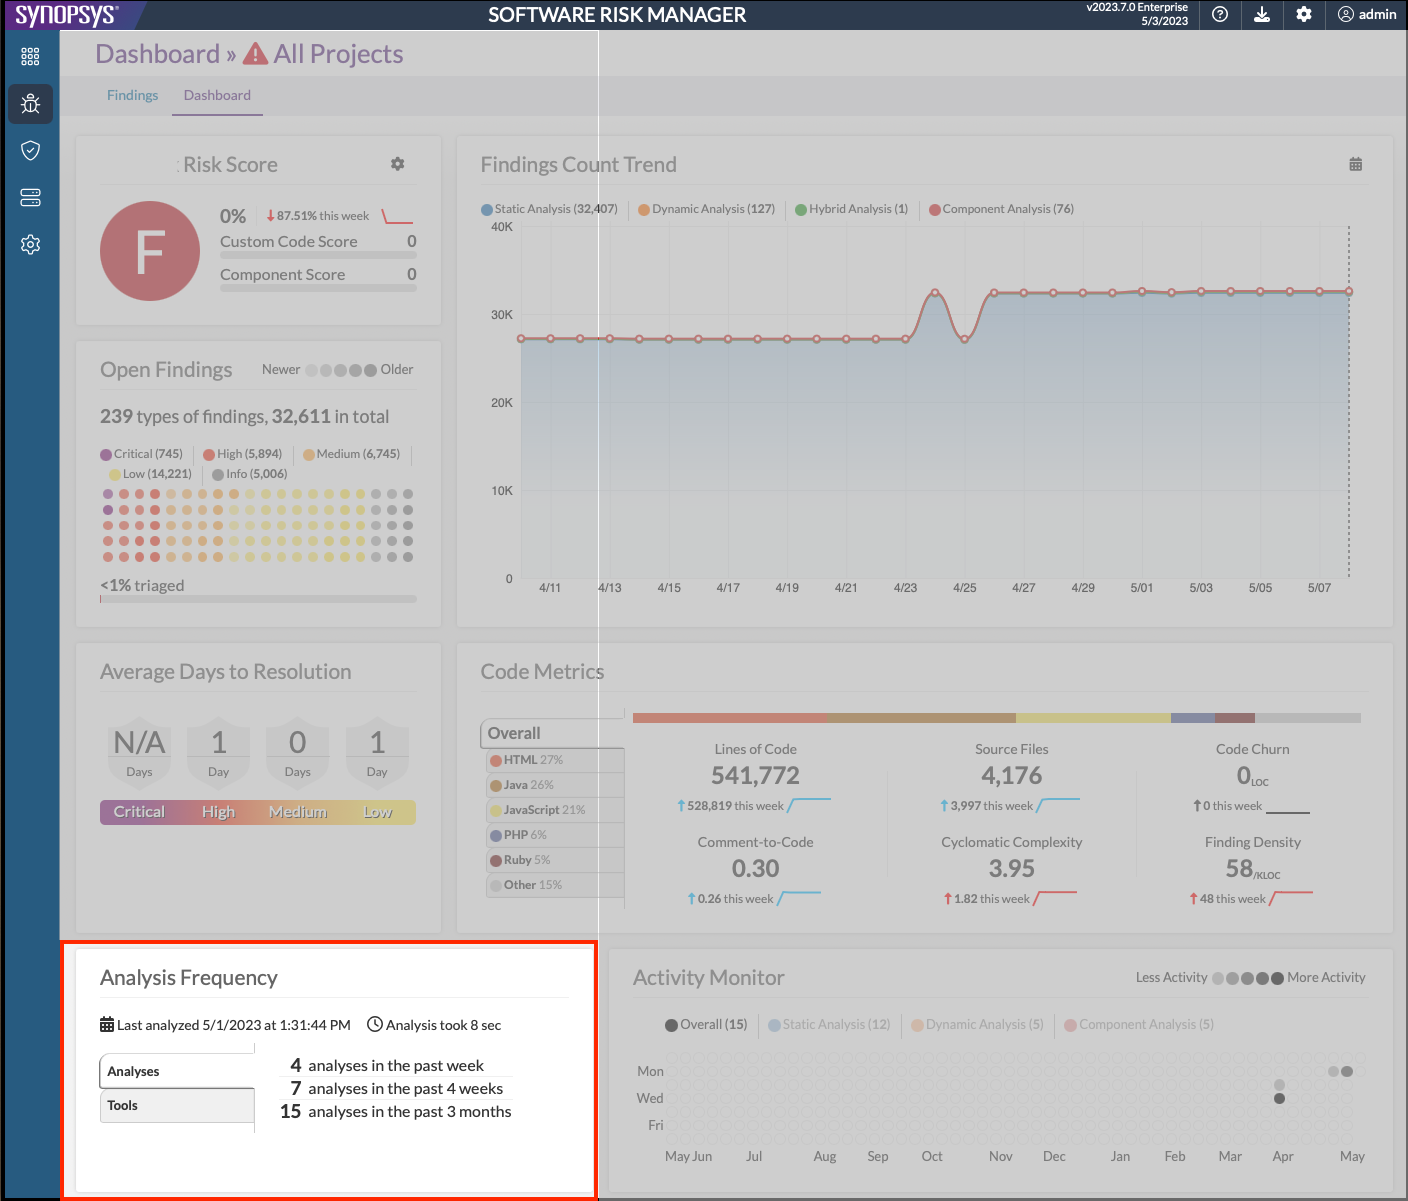
At the top of the section, a text blurb describes when the latest analysis occurred, and how long it took. The rest of the section is broken down into three tabbed sections.
Analyses
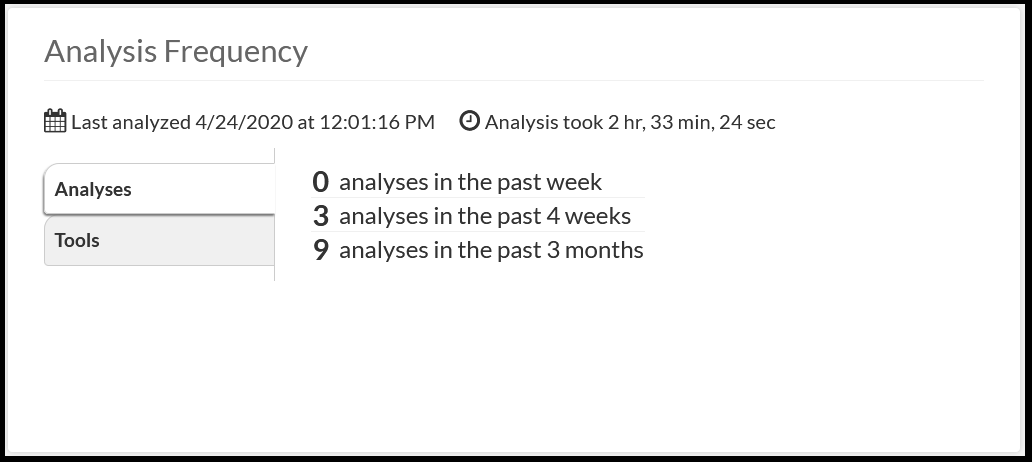
This shows how many analyses were run on the project over the past week, 4 weeks, and 3 months.
Tools
This shows how many unique tools were run in analyses on the project, over the same time periods. (Note that in this context, "tools that were run" means the set of Tools referenced by Findings in Software Risk Manager. It doesn't matter whether you ran the tool separately, or if Software Risk Manager orchestrated a run of the tool on its own.)
Activity Monitor
The Activity Monitor section of the Project Dashboard shows a "calendar heatmap" which represents the analysis activity on the project over the past year.
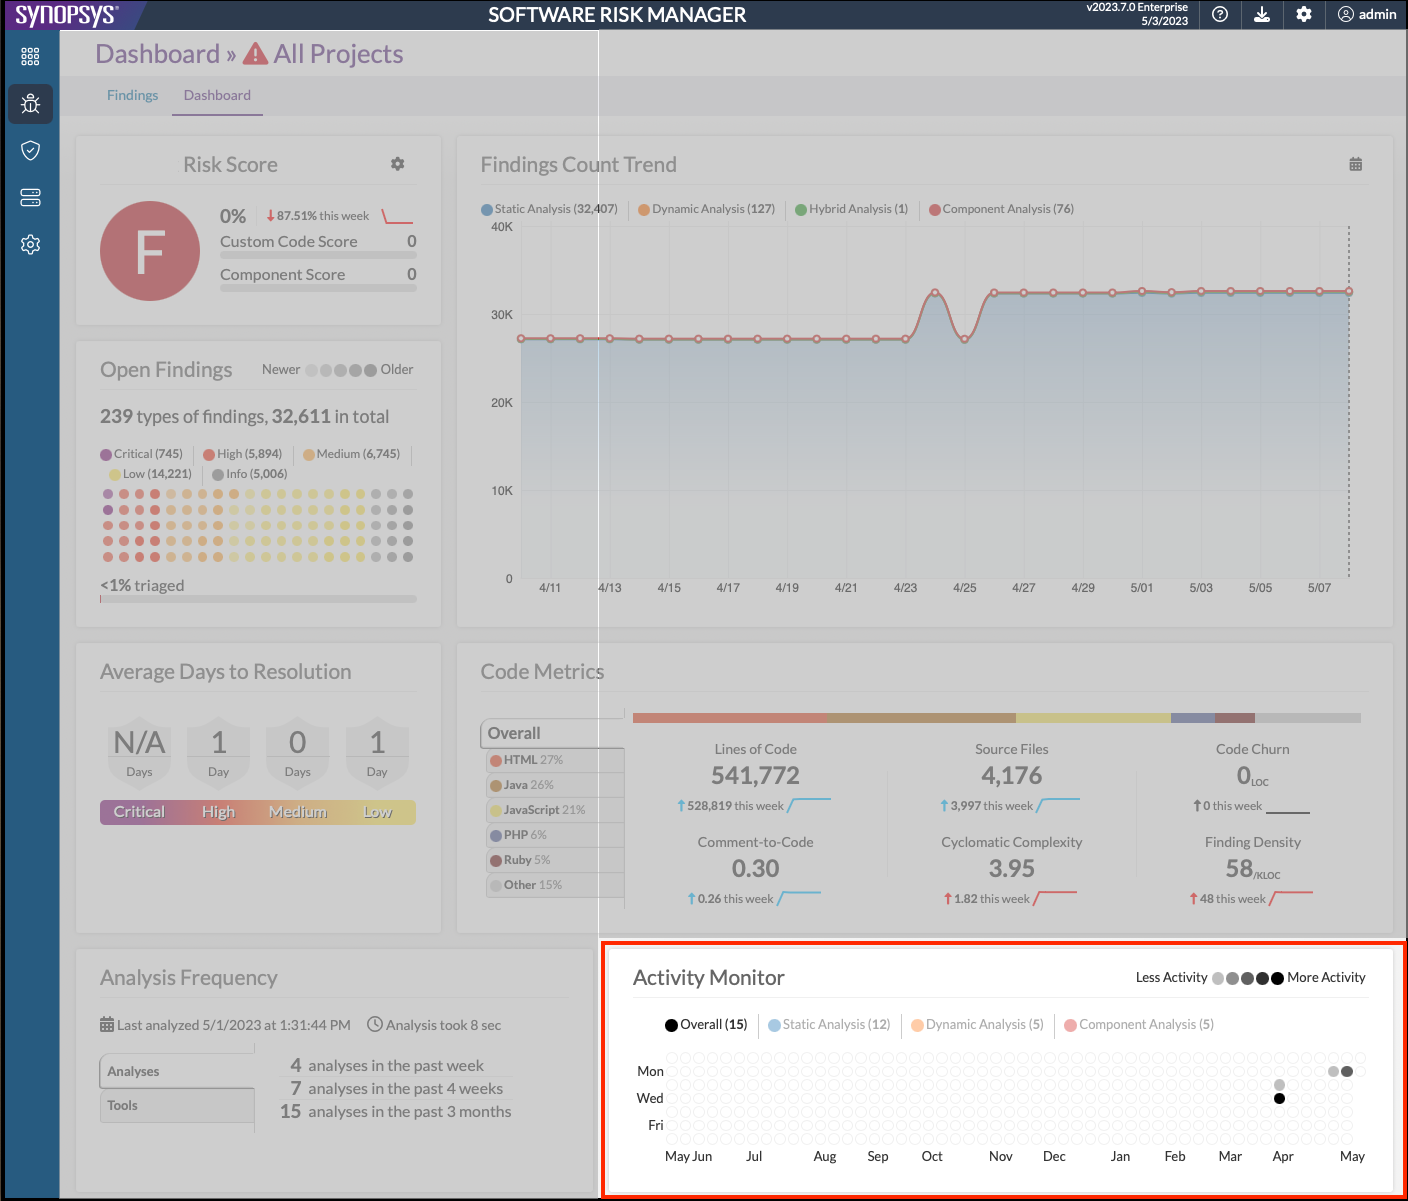
The far left represents dates from a year ago, and the far right represents recent dates. Stepping down a column of the chart, each bubble represents a day of the week, with Sunday at the top, and Saturday at the bottom. Hovering the mouse cursor over any of the bubbles in the chart will cause a tooltip to display the bubble's respective date, and the number of analyses that were run that day.

The analysis activity is broken down by different types of analyses, e.g. Static and Dynamic. The legend items below the visualization represent these different analysis types (i.e. "Detection Methods"). Note that any given analysis may result in findings of different detection methods, depending on what files were uploaded. Clicking the legend items below the visualization will cause the visualization to focus on the legend item's respective detection method. This can cause the number of analyses shown in the tooltip to change. For example, three analyses may have been run on a given day, but only two of those analyses resulted in data from Dynamic Analysis. In this case, if the "Overall" legend item was selected, the tooltip would show "3 analyses on {date}", but when the "Dynamic Analysis" legend item was selected, the tooltip for that same bubble would show "2 analyses on {date}."


The visualization uses brightness to indicate more or less analysis activity for each given day, as indicated by the legend above the visualization. A darker shade of color indicates more analyses, and a lighter/whiter shade of color indicates fewer analyses.
Created vs. Resolved
The Created vs. Resolved section of the Project Dashboard shows the dueling trend of new findings that are added to the project, findings that are resolved by the team, and the difference between the two.

This section is broken into two pieces; the graph, and the table. Both represent the same data.
The graph is broken into two pieces; the "duel", and the "trend".
The "duel" section shows the number of created findings (in red) versus the number of resolved findings (in green). By default, the graph will show an accumulation of these numbers, starting from date at the far left of the graph. The icon in the upper-right corner of the Created vs. Resolved section opens a menu which allows you to toggle between "accumulated" and "daily" counts in the "duel" section. "Daily" counts show the exact number of created and resolved findings for any given day. The colored area between the lines in the "duel" section of the graph indicates which line is higher. A green fill means more findings were resolved as of that day (if using "accumulated" counts), or resolved on that day (if using "daily" counts).
The "trend" section of the graph shows the difference between the red and green lines of the "duel" (in blue). The "duel" and the "trend" graphs have their own separate Y axes representing cumulative finding counts, and count difference, respectively. The two graphs share the same X axis, which represents the date.
When hovering over the graph with the mouse cursor, a vertical line will snap to the nearest date to the mouse, causing the legend above the graph to update its numbers to reflect that date. The corresponding row in the table to the right of the visualization will be highlighted, and the table will auto-scroll to that row if necessary. Similarly, hovering over the table will cause the same changes, depending on which row in the table is hovered.
By default, the Created vs. Resolved section shows the accumulated number of findings since the beginning of the summary time window. Click the graph icon in the upper-right corner of the section, and select "Show daily counts" to switch the graph to Daily mode. Daily mode shows the change in values on a day-to-day basis. Accumulated mode can be considered the Integral of Daily mode, and Daily mode can be considered the Derivative of Accumulated mode.

On the top-right of the graph is a calendar icon, which can be clicked to bring up a menu for selecting a date range.
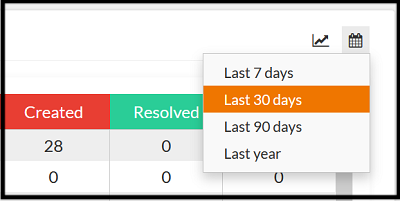
Selecting one of these range values will automatically refresh the graph to the selected range.
For larger date ranges, each point in the graph can represent multiple dates by taking the sum of data samples involved.


Top Findings Types
The Top Finding Types section of the Project Dashboard shows the top 10 types of findings in the project, by number of open findings.

The visualization uses a Stream Graph to represent the relative volume of the top finding types (Y axis) over time (X axis). Each stacked area of a given color represents a specific type of finding, e.g. "SQL Injection". The height of each area represents the number of findings of that type on a given day.
The table to the left of the visualization acts as a legend, where each of the finding types is labelled, and has a colored fill-bar indicating the respective finding type's percentage share of the project.
Hovering the mouse cursor over an item in the table to the left of the visualization will highlight the corresponding area in the visualization. Similarly, hovering the mouse cursor over an area in the visualization will highlight the corresponding item in the table. Clicking an item will cause that item to become "focused". Click the item again to undo the focused state, or click another item to change to another focused state.

As with many of the other dashboard sections, hovering the mouse cursor over the visualization will cause a vertical line to snap to the date nearest to the mouse. When this happens, the table to the left of the visualization will update to reflect the percentages for that day.
Click the graph menu in the upper-right corner to access the "layout" options. By default, the graph uses "stream" layout. Switch to the "stack" layout to rearrange the items into a stack, such that the bottom of the stack aligns with the "0" on the Y axis. Note that with the "stream" layout, the Y axis's meaning differs from date to date, so no axis numbers will be displayed.

On the top-right of the graph is a calendar icon, which can be clicked to being up a menu for selecting a date range.
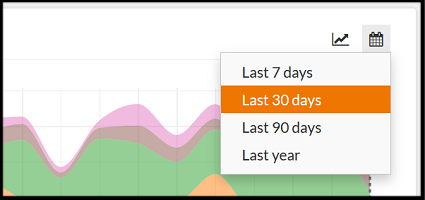
Selecting one of these range values will automatically refresh the graph to the selected range.
For larger date ranges, each point in the graph can represent multiple dates by taking the average finding counts of data samples involved.


