Using Time Filters
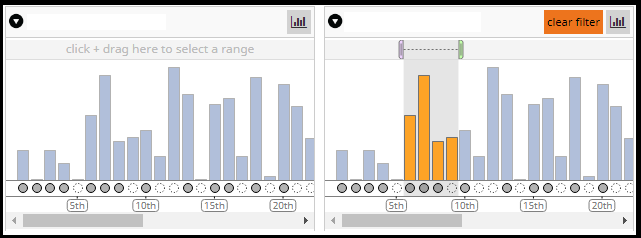
A Time Filter is a special type of filter which groups findings by analysis, that is, the filter will decide which analysis each finding belongs to, and then display the groupings as a bar chart. The analysis number or analysis date will make up the X axis, while the finding count makes up the Y axis.
Unlike the other filters, a Time Filter may not be resized vertically. Instead, as more analyses are displayed it will grow horizontally, eventually adding a horizontal scrollbar.
Making a filter selection with a Time Filter is done by drag-selecting a range in the selection area above the bar chart, as shown in the figure below.

The X axis of each Time Filter can be toggled between "Ordinal" and "Time."
Ordinal scale uses the analysis number (e.g. 1st, 2nd, ...) to determine where each analysis is placed on the X axis. It allots the same amount of horizontal space for each analysis, making it a reliable way to visually separate one analysis from another. Ordinal scale is the default mode for each Time Filter when the page loads.
Time scale uses the start time of the analysis to determine where each analysis is placed on the X axis. Since the lifespan of a project may be very long, and several analyses may be clustered close together, bars may overlap when using time scale mode. This scale mode is most useful when you want to highlight a particular date range without separating individual analyses.

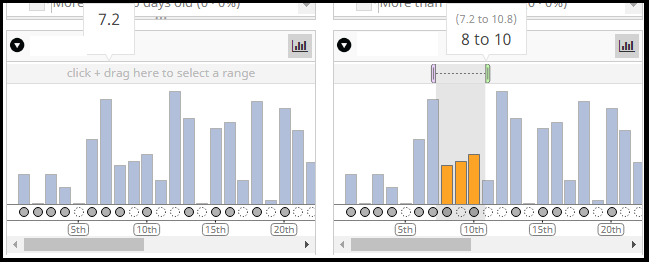
As you hover over the selection area of a Time Filter, you will see a tooltip indicating the X value that your cursor is hovering over. In time scale mode, the X value is a date and time. In ordinal scale mode, the smaller text indicates the "physical" selection range, while the larger text indicates the rounded range, which will be used as the actual filter selection. Once you click and drag to make a selection, the tooltip will expand to show you the "min" and "max" of your selection.
An existing selection can be altered by clicking and dragging either of the paddles (the purple and green paddles at either end of the selection) to resize, or the area between the paddles to pan. Double-clicking a paddle will move it all the way to the beginning or end of the chart. Double-clicking the area between the paddles will clear the selection.

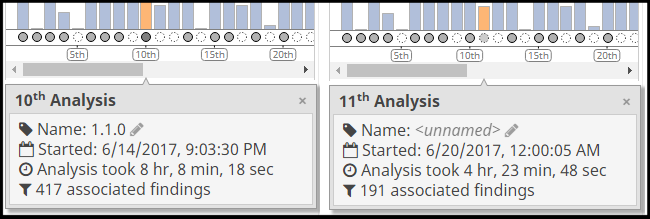
As you hover over bars in a Time Filter's chart area, a tooltip will appear to display information about the currently-hovered analysis. The information includes the start time, duration, number of associated findings (the height of the bar), the analysis number (e.g. the 10th analysis in that project), and the Name.

Note that when an analysis has a name, the circle below its bar in the bar chart will be
filled in; when it has no name, the circle will only have a dotted outline. Users with
the update
role can edit analysis names by clicking the
pencil icon next to the name. Naming an analysis can be useful if you want to associate
it with a particular release version of your software, a Git commit, a Jenkins build, or
anything similar.
In addition, analysis names allow you to write Markdown-style links, e.g., [link
text](link url).

First Seen by SRM Filter
The First Seen by SRM filter is a Time Filter that groups findings based on the analysis during which the finding was first seen in SRM; that is, the analysis that introduced the finding. This filter can be useful for answering questions such as, "how many findings were introduced by release 2.1.0?" Note that the First Seen by SRM filter differs from the Age Filter in that the Age filter takes into account any first-seen dates provided by tools.
Last Modified Filter
The Last Modified filter is a Time Filter which groups findings based on the analysis
during which the finding was last modified. (For findings modified by users or other
non-analysis interactions, it picks the most recent analysis at the time of the
modification.) An example usage of this filter could be in combination with the
Status Filter to answer the
question "How many findings have been fixed since release 2.1.0?" In this example,
you would unhide the "completed" triage statuses by using the View button.
